










BIM 5D integrates the fifth dimension (costs) into the 4D model (3D + time). That way, The team then begins to simulate not only when the work will be carried out, but also as Each step will effectively cost money. Therefore, The schedule ceases to be exclusively temporal and begins to clearly reflect the financial impact of each planning decision.
In practice, Many construction companies realize that certain construction sequences reduce deadlines, but increase costs. In this scenario, BIM 5D makes this trade-off visible, allowing for more balanced technical decisions.
For this reason, This guide presents the professional implementation of BIM 5D, covering everything from quantity take-off to financial scenario simulation and cash flow control.
What is BIM 5D? The Fifth Dimension: Costs
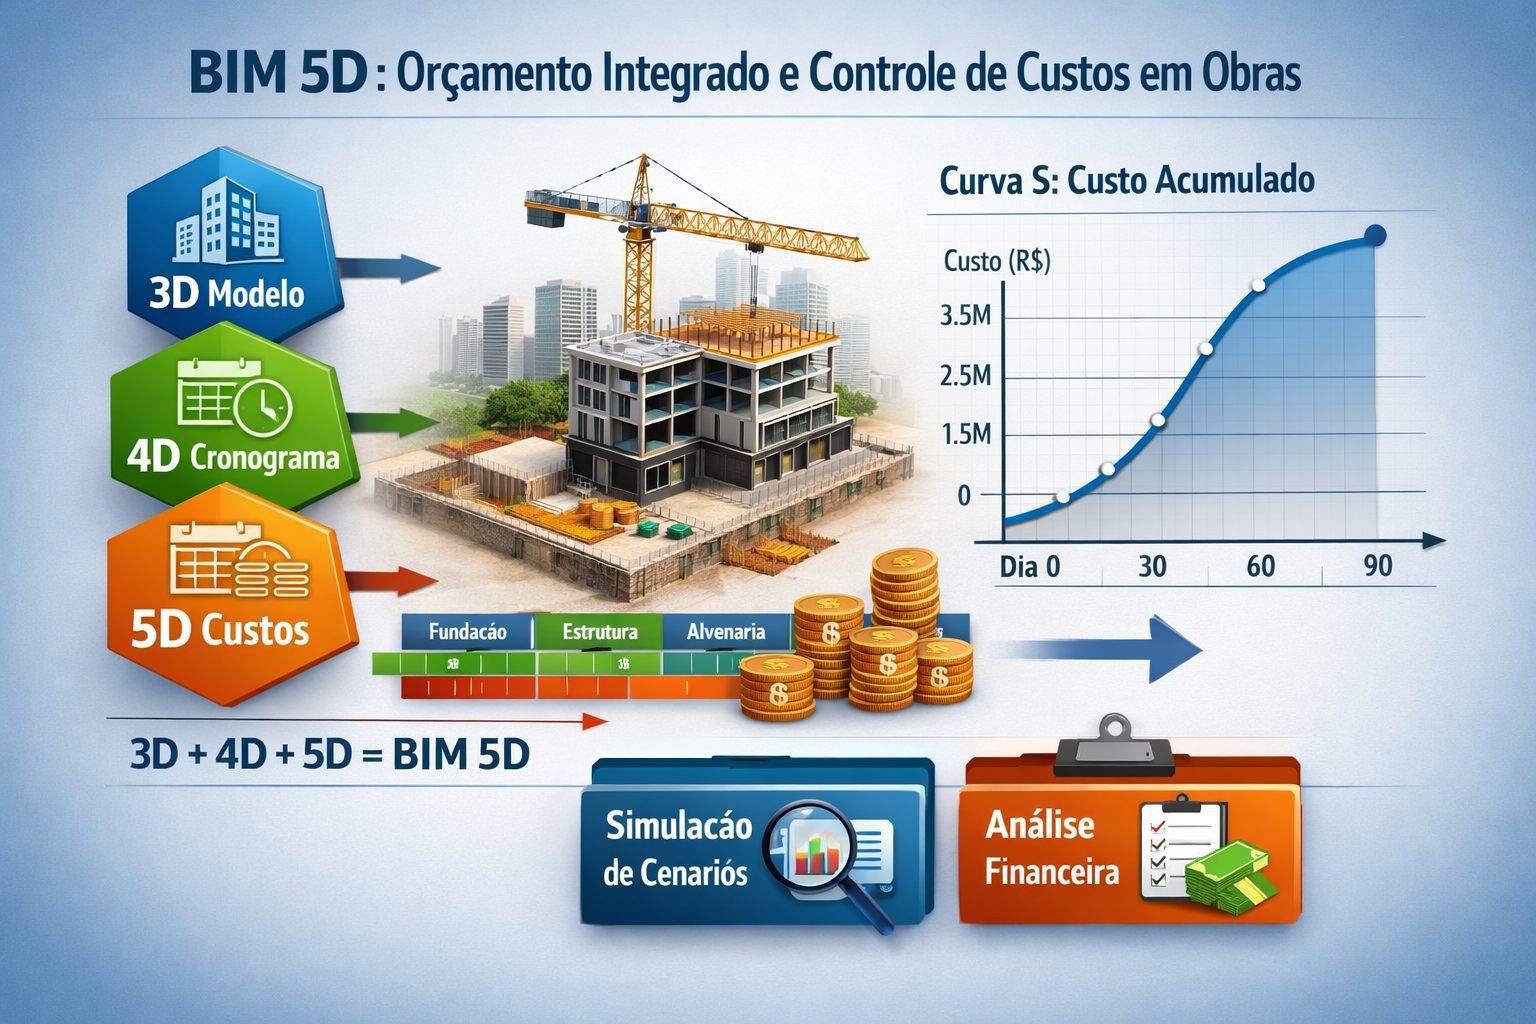
BIM 5D directly links costs to the elements of the 3D model and the activities of the 4D schedule. Like this, The team builds an integrated simulation of time and cost, capable of demonstrating the real financial impact of each decision.
In contrast, In traditional budgeting, spreadsheets remain disconnected from planning. Already in BIM 5D, This integration occurs dynamically. Whenever the schedule is adjusted in Navisworks, The system automatically recalculates costs and cash flow.
5D BIM Equation
BIM 5D = 3D (Geometry) + 4D (Schedule) + 5D (Costs)
Consequently, These dimensions then begin to operate in an integrated manner.
While Geometry defines quantities., the schedule Organizes the sequence and duration.
At the same time, The costs highlight the financial impact of each technical choice.
Complete Workflow: Revit → Navisworks → Financial Analysis
For BIM 5D to function correctly, the team must follow a structured workflow. In that regard, The process involves specific tools and well-defined steps.
Step 1: 3D Modeling with Quantitative Precision
First, the model developed in Revit needs to take into account the future extraction of quantities. Otherwise, Errors propagate to all subsequent stages.
To ensure consistency, However, certain requirements become indispensable:
- Clear nomenclature for traceability
- Complete parametric properties
- Separation by discipline (architecture, structure and MEP)
- Minimum development level LOD 300
- Coding aligned with SINAPI
In summary, The higher the quality of the modeling, the greater the reliability of the budget.
Step 2: Automatic Extraction of Quantities
After modeling, Revit allows you to automatically extract quantities using schedules. In this way, This eliminates a large part of the manual labor.
The process occurs in clear stages:
- Initially, a table is created in Revit.
- Next, the desired elements are selected.
- After that, the relevant parameters are defined.
- Next, the software automatically generates the table.
- Finally, the data is exported to Excel or CSV.
Example of an extracted table:
| Element | Type | Amount | Material | Description |
|---|---|---|---|---|
| Door 1 | Wood | 40 units | 70mm wood | Interior door 0.80 x 2.10 |
| Door 2 | Steel | 10 units | 3mm steel | Fire door 0.90 x 2.10 |
| Window 1 | Glass | 120 units | 6mm glass | Window 1.50 x 1.20 |
About that, A manual survey takes hours or days. In contrast, BIM delivers the same data in minutes.
Step 3: Linking Quantities to Unit Costs
With the quantities extracted, the team links each item to a unit cost. For that, It uses reliable reference databases.
Among the main sources, Among the highlights are:
- SINAPI
- CUB
- Original compositions
- Specific market quotations
In this context, Navisworks allows you to import these tables and automate the linking of costs.
Step 4: Integration with the 4D Timeline
With this integration, each activity in the schedule will incorporate a cost. Like this, Thus, the physical-financial schedule is formed.
| Activity | Duration | Cost | Period |
|---|---|---|---|
| Foundation | 30 days | R$ 800.000 | Jan 1–30 |
| Floor 1 Structure | 20 days | R$ 1,200,000 | Feb 2–21 |
| Masonry, 1st Floor | 25 days | R$ 600,000 | Feb 22–Mar 18 |
| Coverage | 15 days | R$ 900.000 | Apr 1–15 |
Step 5: Simulation in Navisworks and S-Curve
With all the information integrated, Navisworks allows you to visualize cash flow over time. That way, The S-curve then accurately represents the economic performance of the project.
Generally speaking, The curve indicates high investment at the beginning, acceleration in the middle, and a gradual reduction towards the end.
Step 6: Financial Analysis and Cash Flow
With BIM 5D, the team answers strategic questions based on real data. For example:
- How much working capital will be needed?
- What is the financial impact of accelerating a specific phase?
- Which construction sequence results in the lowest total cost?
Like this, In this context, decisions cease to be intuitive and become technical and measurable.
Conclusion: BIM 5D is a Strategic Tool
In short, BIM 5D transforms budgeting into a dynamic and strategic process. As a result, Construction companies that master this methodology make safer, faster, and more profitable decisions.
Therefore, By generating recurring savings of between 5% and 10% in the final cost of the project and providing a return on investment in up to two years, BIM 5D is no longer optional.
On the other hand, Insisting on isolated 2D budgets compromises technical and financial competitiveness in today's market.